
An HPLC chromatogram can show one clean, sharp peak and still belong to the wrong molecule. It tells you how pure a sample is. It does not tell you what the sample is.
That is the job of mass spectrometry. Yet many certificates of analysis for research peptides reduce identity testing to a single word, “conforms”, with no spectrum and no masses to back it up. When independent labs have retested synthetic peptides, they have found samples where the main compound was not the intended sequence at all [1].
This guide explains how mass spectrometry confirms peptide identity, how to read a peptide mass spectrum step by step, and what common mass differences reveal about impurities. It is written as a companion to How to Read an HPLC Chromatogram, and the two are most useful read together.
Citation numbers in square brackets refer to the References section at the end.
Why Peptides Need Mass Spectrometry
HPLC measures purity; MS measures identity
HPLC separates the components of a sample and measures how much of the UV signal belongs to the main peak. It cannot tell you whether that peak is the right sequence. A peptide with the wrong residue in one position, or a different peptide altogether, can still give a single, sharp peak.
Mass spectrometry (MS) measures the mass of the molecules in a sample. Since the mass of a peptide follows directly from its sequence, a match between the measured mass and the expected mass is strong evidence that the right molecule was made.
What “identity confirmed” should mean
On a COA, identity should be supported by three things: the theoretical mass calculated from the sequence, the observed mass from the instrument, and the spectrum itself. A word like “conforms” or “passes” without those numbers is a claim rather than evidence.
Why the two methods work together
HPLC and MS are orthogonal methods. They measure different properties, so one covers the blind spots of the other. HPLC is good at telling you how much of a sample is one species. MS is good at telling you what that species is. A synthetic peptide is properly characterized only when both have been done on the same lot.
How Mass Spectrometry Works
Every mass spectrometer, however complex, does three things in order:
- Ionization. The sample is given an electric charge, because only charged particles can be steered by electric and magnetic fields.
- Mass analysis. The ions are separated according to their mass-to-charge ratio.
- Detection. The separated ions are counted, and the instrument records how many arrive at each mass-to-charge value.
The result is a mass spectrum: a plot of signal intensity against mass-to-charge ratio.
What m/z means
A mass spectrometer does not measure mass directly. It measures m/z, the mass of an ion divided by its charge. An ion with a mass of 1,500 Da carrying one charge appears at m/z 1,500. The same molecule carrying two charges appears at about m/z 750. This is why a single peptide can produce several peaks in one spectrum, and why reading a spectrum means working out the charge on each ion before you can work out its mass.
Ionization Methods for Peptides
Peptides are large, polar and fragile, so older ionization methods tended to break them apart. Two “soft” techniques developed in the late 1980s changed that, and between them they account for almost all peptide mass spectrometry done today [4]. Their inventors, John Fenn and Koichi Tanaka, shared part of the 2002 Nobel Prize in Chemistry; Michael Karas and Franz Hillenkamp developed the matrix-based form of laser ionization used in most labs.
Electrospray ionization (ESI)
In electrospray ionization, the peptide solution is pumped through a fine needle held at high voltage. The liquid leaves the tip as a mist of charged droplets. As the solvent evaporates, the charge is transferred to the peptide molecules, which pick up extra protons.
The defining feature of ESI is multiple charging. A single peptide produces a family of ions, such as [M+2H]²⁺ and [M+3H]³⁺, each differing from its neighbour by one charge [2]. That can look confusing at first, but it is very useful: the series contains enough information to calculate the intact mass precisely.
Because ESI works from a flowing liquid, it couples directly to an HPLC system. That is what makes LC-MS possible.
Matrix-assisted laser desorption/ionization (MALDI)
In MALDI, the peptide is mixed with a large excess of a small, UV-absorbing organic compound called a matrix, then dried onto a metal plate. A pulsed laser fires at the spot. The matrix absorbs the energy and lifts the peptide into the gas phase as an ion, without destroying it [3].
Common matrices include α-cyano-4-hydroxycinnamic acid (CHCA) for peptides, sinapinic acid for larger proteins, and 2,5-dihydroxybenzoic acid (DHB). MALDI mostly produces singly charged ions, [M+H]⁺, which makes the spectrum simple to read.
ESI and MALDI compared
| Feature | ESI | MALDI |
|---|---|---|
| Sample form | Solution, flowing | Dried spot with matrix |
| Typical ions | Multiply charged, [M+nH]ⁿ⁺ | Mostly singly charged, [M+H]⁺ |
| Coupling to HPLC | Direct (LC-MS) | Offline only |
| Spectrum appearance | Series of peaks for one peptide | One main peak per peptide |
| Tolerance to salts | Low; salts suppress signal | Moderate |
| Common analyzer pairing | Quadrupole, Q-TOF, Orbitrap, ion trap | TOF |
| Typical COA use | LC-MS identity and impurity work | Quick intact-mass confirmation |
Neither is better in general. MALDI is fast and easy to interpret for a simple identity check. ESI, especially as LC-MS, gives more information because it can assign a mass to each HPLC peak.
Mass Analyzers You Will See on Reports
Once the peptide is ionized, the mass analyzer separates the ions by m/z. The type of analyzer largely decides how precise the measurement is, so it is worth knowing which one produced the data on your COA.
- Quadrupole. Four parallel rods use oscillating electric fields to let through only ions of a chosen m/z at a time. Single quadrupoles are robust and common in routine LC-MS, but they measure mass to roughly the nearest 0.1–0.5 Da. A triple quadrupole links two mass-filtering quadrupoles with a collision cell between them and is used mostly for targeted quantitation.
- Time-of-flight (TOF). Ions are accelerated down a flight tube, and lighter ions arrive at the detector sooner. TOF analyzers are fast and have a wide mass range, and they are the usual partner for MALDI. A Q-TOF places a quadrupole in front of the TOF, which allows ions to be selected and fragmented.
- Ion trap. Ions are held in an electric field and released in order of m/z. Ion traps are good at fragmentation experiments but generally have lower resolution and mass accuracy than TOF or Orbitrap instruments.
- Orbitrap. Ions orbit around a central electrode, and their oscillation frequency is converted into m/z. The Orbitrap belongs to the Fourier transform family of analyzers and offers very high resolution and mass accuracy in a compact instrument [5].
Resolution and mass accuracy
Two terms matter when you judge an analyzer’s output:
- Resolution is the ability to tell apart two ions with very similar m/z. High resolution lets you see a peptide’s individual isotope peaks, and separate an impurity that differs from the target by a fraction of a dalton.
- Mass accuracy is how close the measured mass is to the true, calculated mass. It is usually expressed in parts per million (ppm) [6]:

For example, a peptide with a theoretical monoisotopic mass of 1,500.7500 Da measured at 1,500.7530 Da has an error of 2.0 ppm.
| Analyzer | Typical resolution | Typical mass accuracy | Common use for peptides |
|---|---|---|---|
| Single quadrupole | Unit (about 1 Da) | ~0.1–0.5 Da | Routine LC-MS identity checks |
| Ion trap | Low to moderate | ~0.1–0.5 Da | Fragmentation (MS/MS, MSⁿ) |
| TOF / Q-TOF | ~10,000–60,000 | Low ppm | MALDI-TOF, accurate-mass LC-MS |
| Orbitrap | ~60,000 to several hundred thousand | Low ppm, often under 3 ppm | High-resolution identity and impurity work |
These ranges vary by instrument model and calibration, and high-resolution analyzers can reach low-ppm or sub-ppm accuracy when well calibrated [7]. The practical point is simple: a mass reported to four decimal places means something on an Orbitrap or Q-TOF. On a single quadrupole, it does not.
Key Concepts Before You Read a Spectrum
Monoisotopic mass vs. average mass
Most elements come in more than one stable isotope. Carbon, for example, is mostly carbon-12 but about 1.1% carbon-13. So a peptide is not one mass but a small family of masses.
- The monoisotopic mass is the mass of the molecule made only of the most common isotope of each element (¹²C, ¹H, ¹⁴N, ¹⁶O, ³²S). It is the lightest peak in the isotope cluster.
- The average mass is the weighted average across all natural isotopes. It is what you would weigh on a balance.
For a peptide of around 1,500 Da, the average mass is roughly 1 Da higher than the monoisotopic mass. High-resolution instruments report the monoisotopic mass. Low-resolution instruments, which cannot separate the individual isotope peaks, effectively measure the average. A COA should say which one it lists. Comparing a monoisotopic observed mass to an average theoretical mass creates a false 1 Da mismatch.
The isotope pattern
On a high-resolution spectrum, each ion appears as a small cluster of peaks rather than one line. The first is the monoisotopic peak; the next contains one ¹³C atom, the next two, and so on. As peptides get larger, the heavier isotope peaks grow relative to the first.
Charge states
The spacing between isotope peaks tells you the charge. Neighbouring isotopes differ by about 1 Da in mass, so on the m/z scale they sit 1/z apart:
- Peaks 1.0 apart: charge 1+
- Peaks 0.5 apart: charge 2+
- Peaks 0.33 apart: charge 3+
This is the quickest way to assign a charge state when the instrument resolves the isotopes.
Deconvolution
In ESI, one peptide gives a series of peaks, one for each charge state [2]. Deconvolution is the calculation, usually done by software, that converts that series back into a single neutral mass. For an ion of charge z:

where 1.007 Da is the mass of a proton. Every charge state of the same peptide should give the same value of M.
Adducts
Not every extra peak is an impurity. Peptides often pick up metal ions or solvent molecules during ionization, forming adducts [9]. Relative to the protonated ion, the common ones are:
- Sodium ([M+Na]⁺): +22 Da
- Potassium ([M+K]⁺): +38 Da
- Ammonium ([M+NH₄]⁺): +17 Da
- TFA ([M+H+TFA]⁺): +114 Da, from trifluoroacetic acid in the sample or mobile phase
Adducts usually point to salt or solvent in the sample, not to a problem with the peptide itself.
Worked example
Take a peptide with a monoisotopic mass of 1,800.90 Da. In an ESI spectrum it might appear at m/z 1,801.91 ([M+H]⁺), 901.46 ([M+2H]²⁺), 601.31 ([M+3H]³⁺) and 451.23 ([M+4H]⁴⁺). The figure below shows that pattern.
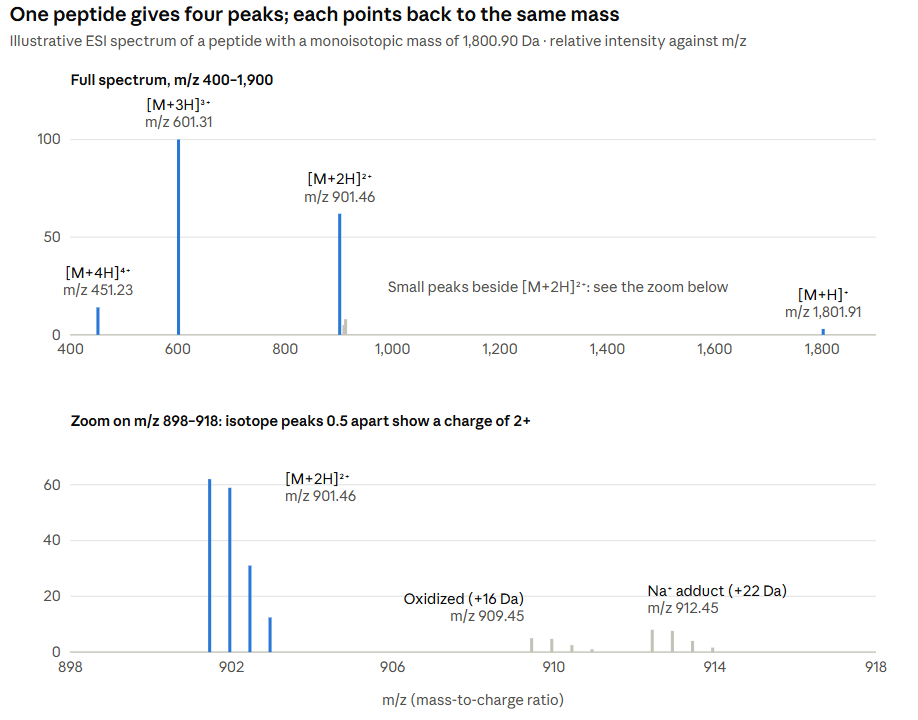
The zoomed view makes one important point clear. On the 2+ ion, an oxidized impurity that is 16 Da heavier appears only 8 units higher on the m/z scale, and a sodium adduct that is 22 Da heavier appears 11 units higher. A mass difference on the m/z axis has to be multiplied by the charge before you can interpret it.
How to Read a Peptide Mass Spectrum, Step by Step
Step 1: Note the instrument and method
Find out what produced the spectrum: the ionization method (ESI or MALDI), the analyzer, the polarity (almost always positive mode for peptides) and the m/z range scanned. This tells you what kind of ions to expect and how precise the masses should be.
Step 2: Calculate or confirm the theoretical mass
The theoretical mass comes from the sequence, including any modifications such as C-terminal amidation, N-terminal acetylation or disulfide bonds. Check whether the COA quotes a monoisotopic or an average mass, and compare like with like.
Step 3: Find the most intense peaks
Identify the tallest peaks in the spectrum. In MALDI, the main peak is usually [M+H]⁺. In ESI, expect a series of peaks from the same peptide at different charge states.
Step 4: Work out the charge state of each ion
If the isotopes are resolved, measure the spacing between them: 1.0 means 1+, 0.5 means 2+, 0.33 means 3+. If they are not resolved, look for a series of peaks that converge on the same mass when you apply the deconvolution formula.
Step 5: Calculate the neutral mass
For each major ion, calculate M = z × (m/z) − z × 1.007, or check the deconvoluted mass reported by the software. All charge states of the same peptide should agree closely.
Step 6: Compare observed and theoretical mass
Calculate the difference in daltons and, for high-resolution data, in ppm [6]. As a rough guide, a single quadrupole should agree within a few tenths of a dalton, while a well-calibrated Q-TOF or Orbitrap should agree within a few ppm. A larger error, or a difference close to a whole number of daltons, needs explaining.
Step 7: Account for adducts
Before flagging a mismatch, check whether the extra mass matches a common adduct: +22 Da for sodium, +38 Da for potassium, +17 Da for ammonium or +114 Da for TFA [9]. Remember to divide by the charge: on a 2+ ion, a sodium adduct appears 11 units higher on the m/z scale.
Step 8: Look for impurity masses
Next, look at the smaller peaks. Calculate their neutral masses and compare them with the target. Many common impurities produce a predictable mass difference, and the next section lists the ones you are most likely to see.
Step 9: Link the spectrum to the HPLC data
Finally, connect the two datasets. Does the mass spectrum belong to the same lot as the chromatogram? If LC-MS was used, does the target mass belong to the main HPLC peak, and do the impurity masses line up with the smaller peaks? That is what turns two separate tests into a complete picture.
Common Mass Shifts and What They Mean
When a peak sits a fixed distance from the target mass, that distance is often enough to suggest what happened. The values below are neutral mass differences relative to the target peptide. Monoisotopic values for chemical modifications come from Unimod, the standard reference database for modification masses [8]; protecting-group masses follow from their elemental composition and the chemistry of Fmoc synthesis [10].
| Mass difference | Likely cause | Where it usually comes from |
|---|---|---|
| +15.995 Da | Oxidation of one methionine (or tryptophan) | Air exposure during synthesis, handling or storage |
| +31.990 Da | Two oxidations | Further oxidation, or two oxidizable residues |
| +0.984 Da | Deamidation of asparagine or glutamine | Storage in solution, especially in Asn-Gly sequences |
| −18.011 Da | Loss of water, for example aspartimide formation | Base exposure during Fmoc synthesis at aspartic acid |
| −2.016 Da | Disulfide bond formation | Oxidation between two cysteines, intended or not |
| Minus one residue mass (e.g. −57.02 for Gly, −71.04 for Ala, −113.08 for Leu/Ile) | Deletion sequence | An incomplete coupling step during synthesis |
| +42.011 Da | Acetylation | Capping of unreacted chains, or an unintended N-terminal acetyl group |
| +56.063 Da | Leftover tert-butyl (tBu) group | Incomplete side-chain deprotection |
| +242.110 Da | Leftover trityl (Trt) group | Incomplete deprotection of Cys, His, Asn or Gln |
| +252.082 Da | Leftover Pbf group on arginine | Incomplete deprotection; Pbf is slow to remove |
| 2 × M (or 2M − 2 for a disulfide-linked dimer) | Dimer | Aggregation, or two chains joined by a disulfide |
| +21.982 Da | Sodium adduct (not an impurity) | Salt in the sample or glassware |
| +37.956 Da | Potassium adduct (not an impurity) | Salt in the sample or glassware |
What a mass shift can and cannot tell you
A mass shift tells you what changed, but not always where. A +16 Da peak in a peptide with two methionines could mean oxidation at either one. A −113 Da peak could be a missing leucine or a missing isoleucine, because those two residues have identical masses. To locate a modification or tell isomers apart, you need tandem mass spectrometry, covered below.
Small shifts also need enough resolution to see. Deamidation adds less than 1 Da, which shifts the isotope pattern rather than creating a separate peak. On a low-resolution instrument, it can be almost invisible.
LC-MS: Combining Separation and Identity
In LC-MS, the outlet of an HPLC column feeds straight into an ESI source. The mass spectrometer records a full spectrum every second or so as peaks elute. The result links each HPLC peak to its own mass, which neither technique can do alone.
Total ion chromatogram vs. UV trace
An LC-MS run usually produces two traces side by side:
- The UV trace shows absorbance at 214 or 220 nm. This is the trace used for purity.
- The total ion chromatogram (TIC) shows the total ion signal over time.
They look similar but rarely identical. Different peptides ionize with different efficiency, so a small UV peak can be a large TIC peak, and the reverse. That is why purity is calculated from UV, not from the TIC.
Extracted ion chromatograms
An extracted ion chromatogram (XIC) plots the signal at one specific m/z over time. It is one of the most useful tools for impurity work. Want to know whether an oxidized form is present, and where it elutes? Extract the m/z of the oxidized ion and see whether a peak appears, and at what retention time.
Why LC-MS often uses formic acid instead of TFA
TFA gives excellent HPLC peak shapes, but it suppresses the ESI signal. It pairs tightly with the peptide’s charged groups and changes how droplets behave in the source, and the combined effect reduces the number of peptide ions reaching the detector [11]. Many LC-MS methods therefore use formic acid instead. Expect slightly broader peaks and shifted retention times compared with the TFA-based HPLC method on the same COA. This is normal, but it does mean the LC-MS and HPLC traces will not line up perfectly.
Tandem MS (MS/MS) and Sequence Confirmation
An intact mass confirms that the peptide has the right overall composition. It does not prove the residues are in the right order. A scrambled sequence made from the same amino acids has exactly the same mass. Tandem mass spectrometry, or MS/MS, solves this by breaking the peptide apart and weighing the pieces.
How fragmentation works
The instrument selects one ion, the precursor, and fragments it. The main methods are:
- CID (collision-induced dissociation). The ion is collided with an inert gas and breaks mostly at the peptide bonds. It is the most widely used method [4].
- HCD (higher-energy collisional dissociation). A beam-type collision method used on Orbitrap instruments. It produces similar fragments to CID and records the low-mass region well.
- ETD (electron transfer dissociation). An electron is transferred to a multiply charged peptide, breaking the backbone at a different bond and leaving fragile modifications, such as phosphate groups, in place [13].
b-ions and y-ions
When a peptide breaks at an amide bond, it leaves two pieces. If the charge stays on the N-terminal piece, it is called a b-ion. If it stays on the C-terminal piece, it is a y-ion. The naming system, first proposed by Roepstorff and Fohlman, is used throughout the field [12]. ETD produces a related pair, called c- and z-ions [13].
The useful part is the spacing. Each step along a b-ion or y-ion series adds one residue, so the mass difference between neighbouring fragments gives the identity of that residue. Read a full series and you can read the sequence directly. In simple terms:
- b-ion mass = sum of the residue masses + 1.007
- y-ion mass = sum of the residue masses + 18.011 + 1.007
When sequence confirmation matters
Routine COAs rarely include MS/MS, and for a well-established sequence from a reputable supplier, intact mass plus HPLC is usually enough. MS/MS becomes important when:
- The sequence contains residues that could be swapped without changing mass
- You need to know which residue carries a modification
- An unexpected impurity needs identifying
- The peptide is new, complex or heavily modified
Even MS/MS has a limit. Leucine and isoleucine have identical masses and produce identical b- and y-ions under CID or HCD. Telling them apart requires specialized fragmentation that generates side-chain-specific ions, such as combined ETD and HCD (EThcD) [14].
What a Good MS Section on a COA Looks Like
A useful mass spectrometry report does not need to be long. It does need to include enough for you to check the claim yourself:
- The instrument and ionization method, for example “ESI-Q-TOF, positive mode” or “MALDI-TOF, CHCA matrix”
- The theoretical mass, with its type stated (monoisotopic or average)
- The observed mass, or the observed m/z values with their charge states
- The mass error, in daltons or ppm
- The spectrum itself, with labelled axes and the main peaks annotated
- The lot number, matching both the vial and the HPLC report
If any of these are missing, ask the supplier for them. A lab that ran the test will have the data.
Red Flags in Mass Spectrometry Data
Treat any of the following as a reason to ask questions before relying on the material:
- “Conforms” with no data. No theoretical mass, no observed mass, no spectrum.
- A suspiciously perfect match. An observed mass identical to the theoretical mass to three or four decimal places, from an instrument that cannot measure that precisely, suggests the number was typed rather than measured.
- An unreadable spectrum. Missing axis labels, no m/z scale, or an image too small to read.
- The same spectrum for different lots. Identical noise and peak heights across batches mean the data are being reused.
- Large unexplained peaks. Major signals that are neither the target, an expected charge state nor a common adduct, with no comment in the report.
- A match that depends on an unusual adduct. If the observed mass only fits after assuming an uncommon adduct, the identity has not really been confirmed.
- Mismatched lots. MS data from one lot and HPLC data from another.
- Mixed mass types. A monoisotopic observed mass compared with an average theoretical mass, or the reverse, producing a mismatch of about 1 Da that is then explained away.
As with HPLC data, one of these does not prove the peptide is wrong. It does mean the identity claim needs more support before you build an experiment on it. For more on spotting problem certificates, see COA Red Flags: How to Spot a Fake Certificate.
Limitations of Mass Spectrometry
Mass spectrometry is the best routine tool for confirming peptide identity, but it is not the whole answer.
MS does not measure purity on its own
Peak heights in a mass spectrum reflect how well each species ionizes, not just how much of it is present. Two peptides at the same concentration can give very different signals. That is why purity comes from HPLC-UV, and why a clean-looking mass spectrum does not mean a pure sample.
Same-mass problems
Some differences are invisible to mass alone:
- Leucine and isoleucine have identical masses [14].
- D- and L-amino acids have identical masses, so racemization cannot be detected by MS without a chiral separation first.
- Sequence isomers, the same residues in a different order, give the same intact mass and need MS/MS to distinguish.
Ion suppression
Salts, detergents and TFA can reduce the signal from the peptide, sometimes sharply [11]. A weak or missing signal does not always mean the peptide is absent. It may mean the sample or method was not suited to MS.
Resolution limits
Low-resolution instruments cannot separate species that differ by about 1 Da or less. Deamidation, at +0.984 Da, is the classic example. Confirming it usually needs a high-resolution instrument or a careful look at the isotope pattern.
These limits are why the strongest characterization combines HPLC, MS and, where it matters, amino acid analysis and net peptide content testing. The pillar guide, Beyond the Label, covers how those methods fit together.
Quick Reference Checklist
Use this list each time you review the mass spectrometry section of a COA:
- The instrument, ionization method and polarity are stated
- The theoretical mass is given, with its type (monoisotopic or average)
- The observed mass matches within the error expected for that instrument
- Charge states are assigned and agree on the same neutral mass
- Adducts are identified and not mistaken for impurities
- Any significant impurity masses are explained
- The actual spectrum is included, not just a summary
- The lot number matches the vial and the HPLC report
Conclusion
HPLC shows that a sample is clean. Mass spectrometry shows that it is the right molecule. You need both.
Reading a mass spectrum is less daunting than it first looks. Know which instrument produced it. Compare like with like: monoisotopic with monoisotopic, average with average. Work out the charge before the mass. Check for adducts before calling something an impurity. Then use the common mass shifts to understand what the smaller peaks are telling you.
A COA that gives you the theoretical mass, the observed mass, the error and the spectrum itself lets you do all of this in a few minutes. One that says only “conforms” leaves the most basic question about your material unanswered.
Read this alongside How to Read an HPLC Chromatogram and the pillar guide, Beyond the Label. The natural next step is Net Peptide Content vs. Purity.
This article is for educational and informational purposes only. Research peptides are intended strictly for laboratory and in vitro research and are not approved by Health Canada for human or veterinary use.
References
- Verbeke F, Wynendaele E, Braet S, D’Hondt M, De Spiegeleer B. Quality evaluation of synthetic quorum sensing peptides used in R&D. Journal of Pharmaceutical Analysis. 2015;5(3):169–181. PMC5762210
- Fenn JB, Mann M, Meng CK, Wong SF, Whitehouse CM. Electrospray ionization for mass spectrometry of large biomolecules. Science. 1989;246(4926):64–71. doi:10.1126/science.2675315
- Karas M, Hillenkamp F. Laser desorption ionization of proteins with molecular masses exceeding 10,000 daltons. Analytical Chemistry. 1988;60(20):2299–2301. doi:10.1021/ac00171a028
- Aebersold R, Mann M. Mass spectrometry-based proteomics. Nature. 2003;422(6928):198–207. doi:10.1038/nature01511
- Zubarev RA, Makarov A. Orbitrap mass spectrometry. Analytical Chemistry. 2013;85(11):5288–5296. doi:10.1021/ac4001223
- Brenton AG, Godfrey AR. Accurate mass measurement: terminology and treatment of data. Journal of the American Society for Mass Spectrometry. 2010;21(11):1821–1835. doi:10.1016/j.jasms.2010.06.006
- Godfrey AR, Brenton AG. Accurate mass measurements and their appropriate use for reliable analyte identification. Analytical and Bioanalytical Chemistry. 2012;404(4). doi:10.1007/s00216-012-6136-y
- Creasy DM, Cottrell JS. Unimod: protein modifications for mass spectrometry. Proteomics. 2004;4(6):1534–1536. PubMed 15174123. Database: unimod.org
- Waters Corporation. What are common adducts in ESI mass spectrometry? Knowledge Base article WKB67428. support.waters.com
- Behrendt R, White P, Offer J. Advances in Fmoc solid-phase peptide synthesis. Journal of Peptide Science. 2016;22(1):4–27. PMC4745034
- Apffel A, et al. Enhanced sensitivity for peptide mapping with electrospray liquid chromatography–mass spectrometry in the presence of signal suppression due to trifluoroacetic acid-containing mobile phases. Journal of Chromatography A. 1995;712(1):177–190.
- Roepstorff P, Fohlman J. Proposal for a common nomenclature for sequence ions in mass spectra of peptides. Biomedical Mass Spectrometry. 1984;11(11):601. doi:10.1002/bms.1200111109
- Syka JEP, Coon JJ, Schroeder MJ, Shabanowitz J, Hunt DF. Peptide and protein sequence analysis by electron transfer dissociation mass spectrometry. Proceedings of the National Academy of Sciences USA. 2004;101(26):9528–9533. doi:10.1073/pnas.0402700101
- Samgina TY, Kovalev SV, Tolpina MD, et al. EThcD discrimination of isomeric leucine/isoleucine residues in sequencing of the intact skin frog peptides with intramolecular disulfide bond. Journal of the American Society for Mass Spectrometry. 2018;29:842–852. doi:10.1007/s13361-017-1857-y