
Most certificates of analysis for research peptides include an HPLC chromatogram. Most readers glance at the purity figure printed beside it and move on. That is a missed opportunity, because the chromatogram is the actual evidence, and the number is only a summary of it.
A figure like 98.6% hides a lot. It depends on the column, the gradient, the detection wavelength and the choices the analyst made when integrating the peaks. Two labs can run the same sample and report different results, and both can be honest. The chromatogram is where you see why.
This guide walks through a peptide chromatogram one step at a time. By the end, you should be able to assess one in a few minutes, check whether the purity claim holds up, and recognize the warning signs that call for more data. If you need background on how purity differs from net peptide content, start with our pillar guide, Beyond the Label: Understanding Peptide Research, Purity, and Analytical Testing.
What an HPLC Chromatogram Shows
A chromatogram is a plot of detector signal against time. Each peak represents something that came off the column and absorbed light at the detector. For peptides, almost all purity work uses reverse-phase HPLC (RP-HPLC), which separates molecules by how hydrophobic they are.
How reverse-phase separation works
The column is packed with silica particles coated in a non-polar layer, most often C18 (octadecyl) chains. This is the stationary phase. The liquid pumped through it is the mobile phase, usually water mixed with an increasing proportion of acetonitrile over the run. This is called gradient elution.
At the start, the mobile phase is mostly water, so peptides stick to the C18 surface. As acetonitrile rises, they release one by one. More hydrophilic species come off first; more hydrophobic ones hold on longer. Small differences in sequence, such as one missing residue or one oxidized methionine, are often enough to separate two species.
The x-axis: retention time
The horizontal axis shows retention time, in minutes from injection. A peptide’s retention time depends on its hydrophobicity and on the method. On its own, it does not identify a compound. Under fixed conditions, though, it should be consistent from run to run and from lot to lot.
The y-axis: detector response
The vertical axis shows absorbance, usually in milli-absorbance units (mAU). Peptide purity is normally measured by UV detection at 214 or 220 nm, where the peptide bond absorbs strongly. Some reports also show a second wavelength, such as 280 nm, which picks up only residues like tryptophan and tyrosine.
Peaks, baseline and the solvent front
- Peaks are the compounds that eluted. The tallest is usually the target peptide, called the main peak.
- The baseline is the signal when nothing is eluting. It should be flat or drift gently as the gradient changes.
- The solvent front, or void time (t₀), is the first disturbance after injection. It marks unretained material and is not part of the purity calculation.
The figure below shows a typical peptide trace at full scale and the same run zoomed in on the baseline. Notice how little of the impurity profile is visible at full scale.
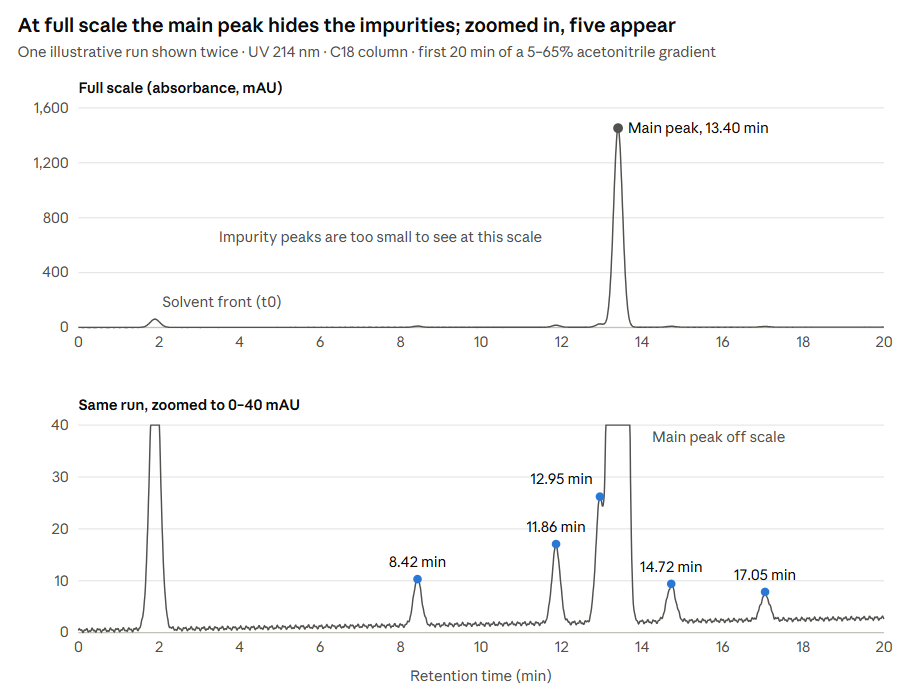
At full scale, only the solvent front and the main peak stand out. The zoomed view of the same data shows the impurity profile, including a peak sitting just ahead of the main peak, which is the one most likely to be missed.
Before You Start: Find the Method Details
A chromatogram without its method is like a measurement without units. Before looking at a single peak, find the conditions the run was performed under. A good report lists them in a header or a short table.
| Parameter | What you will usually see | Why it matters |
|---|---|---|
| Column | C18 or C8, e.g. 4.6 × 150 mm, 3–5 µm particles | Stationary phase and dimensions set how well peaks separate |
| Pore size | 100–130 Å for short peptides, 300 Å for larger ones | Larger peptides need wider pores to reach the bonded surface |
| Mobile phase A | Water with 0.1% trifluoroacetic acid (TFA) | The aqueous starting solvent |
| Mobile phase B | Acetonitrile with 0.1% TFA | The organic solvent that elutes peptides |
| Gradient | e.g. 5% to 65% B over 30 minutes | Steepness controls how far apart peaks spread |
| Flow rate | Around 1.0 mL/min for a 4.6 mm column | Affects pressure, peak width and run time |
| Column temperature | Often 25–60 °C | Higher temperatures can sharpen peaks and shift retention |
| Detection | UV at 214 or 220 nm | Sets which species the detector sees |
| Injection volume | Typically 5–20 µL | Too much sample can overload the column and distort peaks |
Why TFA is in the mobile phase
TFA does two jobs. It keeps the mobile phase acidic, and it acts as an ion-pairing reagent, pairing with the positively charged groups on the peptide. This sharpens peaks and improves separation. The trade-off is that TFA suppresses the signal in electrospray mass spectrometry, so LC-MS methods often use formic acid instead. Expect slightly different peak shapes and retention times between the two.
Why the gradient deserves a close look
For peptide purity work, shallow gradients of around 1% acetonitrile per minute are a common choice because they give closely related species room to separate. A very steep or very short gradient compresses everything together. Impurities that would appear as separate peaks may then hide inside the main peak, and the purity figure improves for the wrong reason.
If the report gives no method details at all, treat the purity number as unverified.
How to Read a Peptide Chromatogram, Step by Step
Step 1: Confirm the sample details
Start with the header. It should list the product name, the sequence, the lot number and the date of analysis. Check that the lot number matches your vial. A well-run chromatogram from a different lot tells you nothing about the material you have.
Step 2: Check the axes and the scale
Make sure both axes are labelled and readable, and that the full run is shown. A trace that ends just after the main peak may have been cropped, and anything eluting later is then invisible.
Pay attention to the y-axis. Most software scales it automatically to the tallest peak. When the main peak reaches 1,500 mAU, an impurity at 15 mAU looks like a flat line. A good report includes a zoomed view of the baseline, or at least a peak table that lists the small peaks.
Step 3: Locate the solvent front and any system peaks
The first disturbance, usually in the first two or three minutes, is the solvent front. It comes from unretained material and the injection itself. It should be excluded from the purity calculation.
Some peaks come from the system rather than the sample, such as mobile phase contaminants or carry-over from a previous run. Careful labs inject a blank (mobile phase alone) under the same method. Any peak that appears in both the blank and the sample is not part of the peptide.
Step 4: Identify the main peak
Find the main peak and note its retention time. Ask whether it makes sense for the sequence. A short, hydrophilic peptide should elute fairly early in the gradient; a long, hydrophobic one later. A main peak in an unexpected place is a reason to check the identity data closely.
Step 5: Assess the peak shape
A good main peak is sharp, narrow and close to symmetrical. Departures from that shape tell you something:
- Tailing (a drawn-out back edge) often points to secondary interactions with the column or an ageing column.
- Fronting (a sloped leading edge) usually suggests the column was overloaded or the sample solvent was too strong.
- Broad peaks can indicate aggregation, poor solubility or a slow separation.
- Shoulders on either side of the main peak are a common sign of a closely related impurity that has not fully separated.
- Split peaks may come from a column fault, a mismatched injection solvent or two species eluting almost together.
Shoulders deserve the most attention. If one is merged into the main peak during integration, the impurity is counted as product.
Step 6: Identify the impurity peaks
Look at what elutes on either side of the main peak. Position gives a rough clue to what an impurity might be, though never a firm answer.
- Earlier peaks are more hydrophilic than the target. Oxidized methionine (methionine sulfoxide) is more polar and often elutes slightly earlier. A deletion sequence missing a hydrophobic residue can also elute earlier.
- Later peaks are more hydrophobic. Products of incomplete deprotection, which still carry a bulky protecting group such as tBu, Trt or Pbf, often elute after the main peak.
- Peaks close to the main peak on either side are the hardest to resolve. Deamidation products and deletion sequences often fall here.
To know what an impurity actually is, you need its mass. That is the job of LC-MS, covered in our article Mass Spectrometry for Peptides Explained.
Step 7: Read the peak table
The peak table lists every integrated peak with its retention time, peak area, area percentage and usually its height. Check three things:
- The area percentages should add up to 100%.
- The number of peaks in the table should roughly match the number you can see in the trace, including the zoomed view.
- The main peak’s area percentage should match the purity figure on the COA.
If a visible peak is missing from the table, ask why.
Step 8: Check the integration
Peak integration is how the software measures each peak’s area. It involves choices, and those choices change the result.
- Baseline placement. The baseline should run under the peaks along the true signal floor. A baseline drawn too high cuts off the small peaks.
- How close peaks are split. Overlapping peaks can be separated with a vertical drop line, by skimming a small peak off the side of a large one, or by drawing valley-to-valley. Each method gives a slightly different area.
- Integration threshold. Software ignores peaks below a set size. A high threshold removes small impurities from the calculation entirely.
- Integration window. The software should integrate the whole gradient, not just a slice around the main peak.
The worked example below shows how much these settings can move the final number.
Step 9: Verify the purity calculation
HPLC purity is calculated by area percent:
Purity (%) = (Main peak area ÷ Total area of all integrated peaks) × 100
Recalculate it from the peak table. It takes a minute and catches more errors than you might expect.
Step 10: Cross-check with mass spectrometry
HPLC tells you how clean the sample is. It does not tell you what the main peak is. Check that the COA includes a mass spectrum, and that the observed mass matches the theoretical mass of the sequence. With LC-MS, you can go further and confirm the mass of the main peak and of each impurity peak directly.
Key Performance Terms Worth Knowing
You do not need to calculate these yourself, but knowing what they mean helps you judge whether a method was fit for purpose. Detailed reports and validated methods often state them.
| Term | What it describes | Common benchmark |
|---|---|---|
| Resolution (Rs) | How cleanly two neighbouring peaks are separated | Rs ≥ 1.5 is generally treated as baseline separation |
| Tailing factor (T) | How symmetrical a peak is; 1.0 is perfectly symmetrical | Many methods accept up to 2.0; the harmonized USP <621> text sets 0.8–1.8 for peaks used in quantification, unless a method states otherwise |
| Theoretical plates (N) | Column efficiency; higher numbers mean narrower peaks | Set by each method; a falling plate count suggests a worn column |
| Signal-to-noise ratio (S/N) | How far a peak rises above baseline noise | About 3:1 for the limit of detection, 10:1 for the limit of quantitation |
| Retention factor (k) | How strongly a compound is retained relative to the void time | Set by each method |
Why resolution matters most for purity
If an impurity and the main peak have a resolution well below 1.5, part of one sits under the other. The software cannot measure them accurately as separate peaks, and the purity figure becomes less reliable. Close-eluting impurities are exactly where peptide methods tend to struggle.
Why signal-to-noise matters for small peaks
The limits of detection and quantitation tell you how small an impurity the method can see and measure. A peak at an S/N of 4 is detectable but its area is uncertain. A peak below about 3:1 cannot be distinguished from noise. If a report claims 99.9% purity, the method needs to be sensitive enough to measure impurities at the 0.1% level.
System suitability
Good labs confirm the instrument and column are performing properly before they analyze samples. This check, called system suitability, usually involves injecting a standard and confirming that resolution, tailing, plate count and injection repeatability meet set limits. Pharmacopoeial methods require it under USP General Chapter <621>. Research labs are not bound by that, but a lab that runs system suitability checks routinely is a lab that takes its data seriously.
Worked Example: Reading One Chromatogram
Take a 15-residue research peptide analyzed on a C18 column (4.6 × 150 mm, 3.5 µm, 100 Å) with a gradient of 5% to 65% acetonitrile in 0.1% TFA over 30 minutes, at 1.0 mL/min and 214 nm. It is the same run shown in the figure earlier. Here is the peak table:
| Peak | Retention time (min) | Area (mAU·s) | Area % |
|---|---|---|---|
| 1 | 8.42 | 1,250 | 0.48 |
| 2 | 11.86 | 2,310 | 0.88 |
| 3 | 12.95 | 3,980 | 1.52 |
| 4 (main) | 13.40 | 252,600 | 96.39 |
| 5 | 14.72 | 1,120 | 0.43 |
| 6 | 17.05 | 790 | 0.30 |
| Total | 262,050 | 100.00 |
Working through the steps
- Steps 1–3. The lot number matches, the full 30-minute run is shown, and a zoomed baseline view is included. The disturbance near 1.9 minutes is the solvent front and has been left out of the table, which is correct.
- Steps 4–5. The main peak at 13.40 minutes is sharp and nearly symmetrical. There is a small rise on its leading edge, about half a minute earlier, which is peak 3.
- Step 6. Peak 3 is the most important impurity. It sits close to the main peak, and at 1.52% it is the largest. Peaks 1 and 2 elute earlier and are likely more polar species. Peaks 5 and 6 elute later and could be partly protected by-products. Only MS can confirm either.
- Step 7. The percentages add up to 100.00%, and six peaks are listed, which matches the zoomed trace.
- Steps 8–9. The main peak area divided by the total gives 252,600 ÷ 262,050 × 100 = 96.39%. The arithmetic checks out.
How integration choices change the answer
Now look at what happens if the same data are processed differently.
- Raise the threshold so peaks under 0.5% are ignored. Peaks 1, 5 and 6 disappear from the calculation. The main peak becomes 252,600 ÷ 258,890 = 97.57%.
- Integrate peak 3 together with the main peak. If the analyst does not split the shoulder, its area is counted as product. The main peak becomes 256,580 ÷ 262,050 = 97.91%.
All three figures come from the same chromatogram. The difference is purely in how the peaks were integrated, which is why the chromatogram and the peak table matter more than the headline figure.
The verdict
This lot is about 96.4% pure by HPLC, which suits most quantitative in vitro work if the MS data confirm identity. Peak 3 is worth identifying by LC-MS, since an impurity at 1.5% that elutes this close to the target is likely a closely related sequence.
Red Flags in an HPLC Chromatogram
Some problems are obvious once you know to look for them. Treat any of the following as a reason to ask questions before relying on the material:
- No method details. Column, gradient and wavelength are missing, so the result cannot be judged or reproduced.
- Missing axes or labels. A trace with no time scale or no units is a picture, not data.
- A cropped trace. The image shows the main peak and little else, with the rest of the gradient cut off.
- A very short gradient. A run of a few minutes for a peptide purity test leaves little room for impurities to separate.
- A perfectly flat baseline. Real detectors produce some noise. A baseline with no noise at all suggests the image was edited or redrawn.
- The same chromatogram for different lots. Identical retention times, peak heights and noise patterns across batches mean the report is being reused.
- A peak table that does not match the trace. Peaks are visible in the image but missing from the table, or the table lists peaks that cannot be seen.
- Percentages that do not add up. The listed areas do not total 100%, or the main peak’s area percentage does not match the purity on the COA.
- A purity figure with no chromatogram. A number on its own cannot be checked.
One of these does not prove the material is poor. It does mean the report, as it stands, cannot support the claim made on it. For more on spotting problem certificates, see COA Red Flags: How to Spot a Fake Certificate.
Comparing Chromatograms Across Lots
If you buy the same peptide repeatedly, comparing chromatograms between lots is one of the most useful checks you can make. It only works if the conditions are the same.
- Use the same method. A change in column, gradient or wavelength can shift retention times and change the purity result. Comparing lots run under different methods tells you very little.
- Check retention time consistency. Under identical conditions, the main peak should elute within a narrow window from lot to lot. A large shift suggests either a method change or a different compound.
- Look at the impurity pattern, not just the total. Two lots can both read 97% but carry different impurities. A new peak that was not present before is worth investigating.
- Watch for changes over time. If you re-test an older lot and find new or growing peaks, particularly just before the main peak, the material may be degrading in storage. Oxidation and deamidation are the usual suspects.
Keeping a copy of each lot’s chromatogram alongside your experimental records makes it much easier to trace an unexpected result back to its cause.
Limitations of HPLC-UV
HPLC is the right tool for measuring peptide purity, but it has blind spots. Knowing them helps you understand what a chromatogram can and cannot tell you.
Co-elution
The biggest limitation is co-elution: two species leaving the column at the same time and appearing as one peak. Closely related impurities, such as deletion sequences, are the most likely to do this. A single clean peak does not rule it out. One published evaluation of synthetic peptides found that fewer than half of the samples ordered at 95% purity actually met that level on independent testing, and most of the impurities were deletion sequences.
A diode array detector (DAD), also called a photodiode array (PDA) detector, records a full UV spectrum across each peak. Some labs use it to check peak purity, since a change in spectrum across a peak hints at a hidden species. It helps, but similar peptides often have near-identical UV spectra. LC-MS is the more reliable check.
Differences in UV response
Area percent assumes every species absorbs light about equally per unit amount. At 214 nm this is a reasonable approximation for related peptides, because most of the absorbance comes from the peptide bonds. It is not exact. An impurity with an extra tryptophan, or one that is missing several residues, will absorb differently, and its area will over- or underestimate its true amount.
What HPLC-UV cannot see
Water and inorganic salts do not show up as peaks, and counterions such as TFA come off near the solvent front, outside the purity calculation. That is why a peptide can be 98% pure by HPLC and still contain only 70% peptide by weight. Net peptide content needs separate testing.
Stereochemistry
A peptide with one amino acid converted from its L-form to its D-form may separate slightly on a standard column, or may not separate at all. Confirming stereochemical purity usually needs a dedicated chiral method.
Method dependence
Every purity figure belongs to the method that produced it. A different column, gradient or wavelength can change the result. That is not a flaw of HPLC so much as a reason the method details always need to travel with the number.
HPLC versus UPLC
UPLC (ultra-performance liquid chromatography), also called UHPLC, uses columns packed with particles smaller than 2 µm and runs at much higher pressures. It gives sharper peaks and faster runs, and it can resolve impurities that a conventional HPLC column misses. The principles of reading the chromatogram are the same. Just remember that a UPLC purity figure and an HPLC purity figure for the same sample may not match exactly.
Quick Reference Checklist
Use this list each time you review a peptide chromatogram:
- The lot number on the report matches the vial
- Column, mobile phases, gradient, flow rate and wavelength are all stated
- The full run is shown, with labelled axes
- A zoomed baseline view or a full peak table is provided
- The solvent front and any blank peaks are excluded from the calculation
- The main peak is sharp, symmetrical and elutes where the sequence suggests it should
- Shoulders and close-eluting peaks are integrated separately
- The peak table matches the trace and the areas total 100%
- Your own purity calculation matches the reported figure
- Mass spectrometry data confirm the identity of the main peak
Conclusion
The purity figure on a COA is a summary. The chromatogram is the evidence behind it.
Reading one well comes down to a few habits. Check the method before the peaks. Look at the baseline, not just the main peak. Pay close attention to shoulders and close-eluting impurities, and make sure the integration treats them fairly. Recalculate the number yourself, then confirm identity with mass spectrometry.
None of this takes long once it becomes routine. It is also the most reliable way to know that the peptide going into your experiment is the peptide you think it is.
For the bigger picture on purity, net peptide content and the full range of analytical tests, read our pillar guide, Beyond the Label. The natural next step from here is Mass Spectrometry for Peptides Explained.
This article is for educational and informational purposes only. Research peptides are intended strictly for laboratory and in vitro research and are not approved by Health Canada for human or veterinary use.
References
Reverse-phase HPLC of peptides
- Aguilar MI. Reversed-phase high-performance liquid chromatography. In: Aguilar MI, ed. HPLC of Peptides and Proteins: Methods and Protocols. Methods in Molecular Biology, vol. 251. Humana Press; 2004:9–22. link.springer.com — separation by hydrophobicity, C18 stationary phases, purity assessment after solid-phase synthesis.
- Mant CT, Chen Y, Yan Z, et al. HPLC analysis and purification of peptides. Methods in Molecular Biology. 2007;386:3–55. doi.org — modes of HPLC for peptides and reverse-phase method practice.
- Mant CT, Hodges RS. Analysis of peptides by high-performance liquid chromatography. Methods in Enzymology. 1996;271:3–50. doi.org — retention behaviour, gradients and column selection for peptides.
- Guo D, Mant CT, Hodges RS. Effects of ion-pairing reagents on the prediction of peptide retention in reversed-phase high-performance liquid chromatography. Journal of Chromatography A. 1987;386:205–222. doi.org — the role of TFA and other ion-pairing reagents.
- Chen Y, Mant CT, Hodges RS. Preparative reversed-phase high-performance liquid chromatography collection efficiency for an antimicrobial peptide on columns of varying diameters. PMC2759115 — synthesis impurities closely related to the target, and slow acetonitrile gradients.
Purity, impurities and what UV detection measures
- Verbeke F, Wynendaele E, Braet S, D’Hondt M, De Spiegeleer B. Quality evaluation of synthetic quorum sensing peptides used in R&D. Journal of Pharmaceutical Analysis. 2015;5(3):169–181. PMC5762210 — only 44% of peptides ordered at ≥95% purity met that level on independent QC; most impurities were deletion sequences.
- LifeTein. What Is Peptide Purity? lifetein.com — HPLC purity at 214 nm, and why water, salts and TFA are not reflected in the purity percentage.
System suitability and method performance
- Adjustment of the chromatographic system in US Pharmacopeia monographs: flexibility and limitations. LCGC North America. chromatographyonline.com — system suitability under USP General Chapter <621>, including tailing factor limits.
- ECA Academy. USP: Chapter <621> Chromatography published for comments. gmp-compliance.org — harmonized symmetry factor range of 0.8–1.8.
- Lab Training. HPLC System Suitability Checklist (USP <621> reference). lab-training.com (PDF) — typical criteria for resolution (Rs ≥ 1.5), tailing factor and plate count.
- U.S. Food and Drug Administration. Q2(R2) Validation of Analytical Procedures: Guidance for Industry. March 2024. fda.gov (PDF) — detection and quantitation limits based on signal-to-noise.